Fruit Fiber Chart
Choose a fruit, enter its serving size and compare fiber grams with other fruits from the same list.
Result
—
Result
— g fiber
- Daily reference
- —
- Fruit state
- —
| Fruit | Fiber | Reference |
|---|
· Free
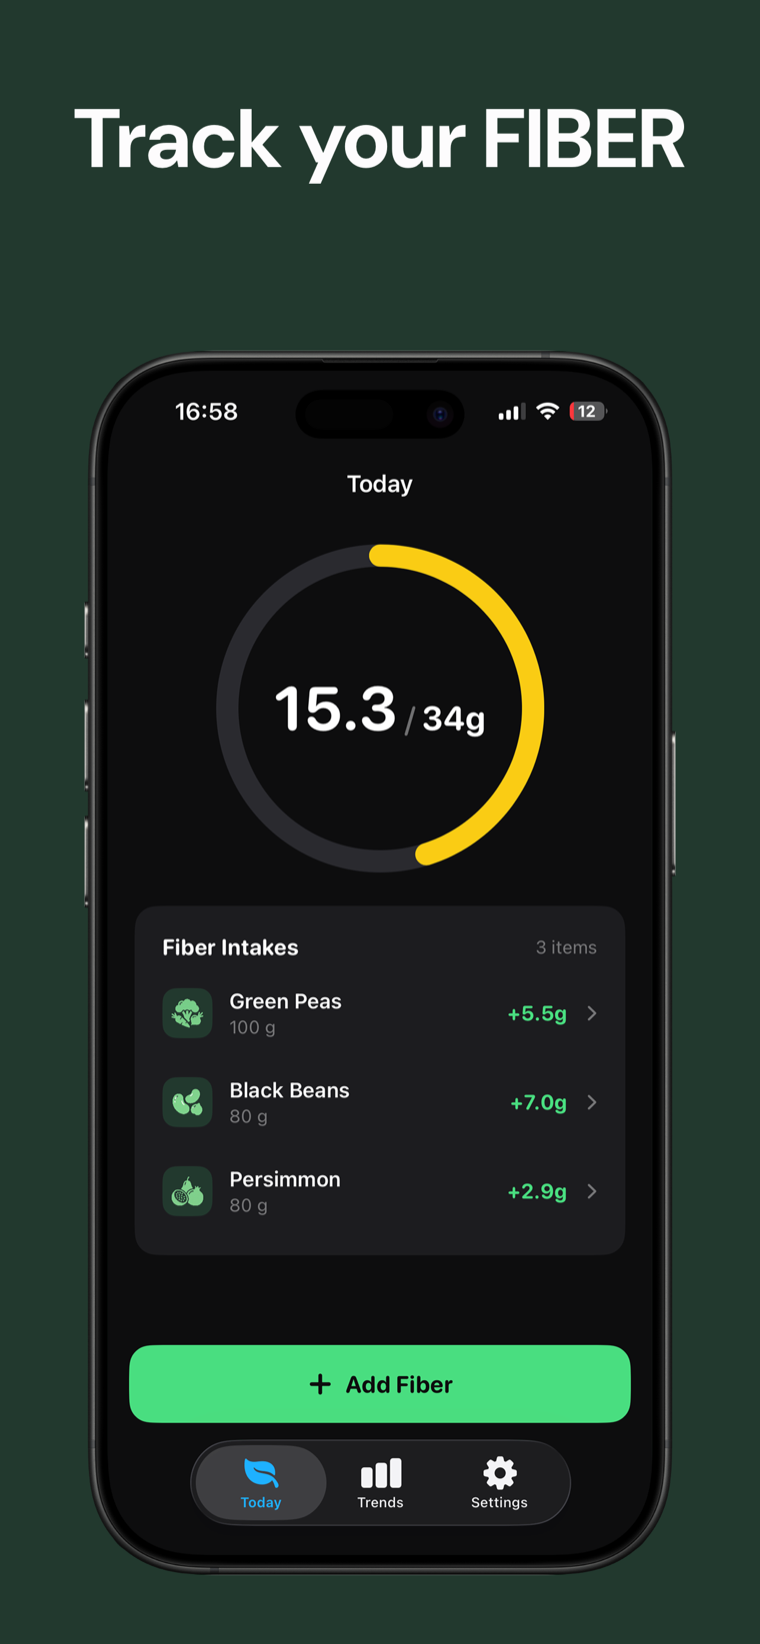
Track it in Fiber Tracker.
Track food notes and daily nutrition references privately on your device.

How the fruit fiber chart works
This fiber in fruit chart scales the source's fiber value per 100 g to the serving size you enter. It helps you see which fruit portions contribute meaningfully to a daily fiber target.
The comparison is sorted from highest to lowest fiber for the same serving size. Raw and prepared entries are kept as described in the food reference, so the chart does not fill gaps with estimates.
fiber grams = fiber per 100 g × serving grams ÷ 100; percent daily value = fiber grams ÷ chosen reference × 100 The default reference is 38 g/day, the source's Adequate Intake for men under 51. Daily needs vary by age and sex; this chart is an information tool, not medical advice.
Fruit fiber chart FAQ
What does the fiber percentage mean?
It is the entered serving's fiber divided by the daily reference you choose, multiplied by 100. The default reference is 38 g/day.
Can I change the serving size?
Yes. Enter any positive serving size in grams; the tool scales the fixed per-100 g source value without rounding before computing.
Why is prunes listed as prepared?
The source lists prunes as dried plums, while the other fruit entries used here are described as raw. The tool preserves those source descriptions.
Does the comparison use equal portions?
Yes. Every selected fruit is calculated using the serving size entered for the main result.
Are my entries saved?
No. The calculation runs in your browser and this component does not save the values you enter.